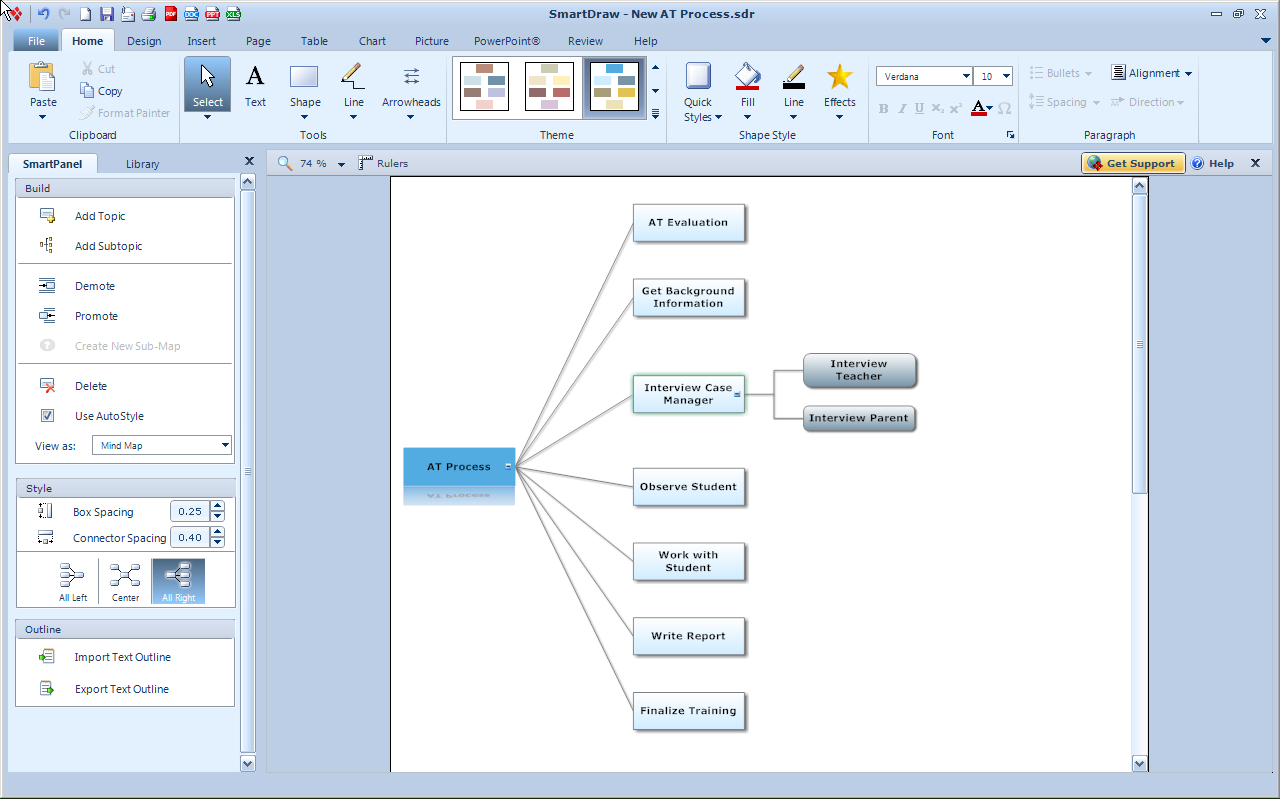
If you follow the mind mapping arena you will probably have noticed the blogs and videos that SmartDraw has created about the benefits of visual communication. The videos are done very well and really speak to the heart of the issue- with the right visuals we can all be more efficient and productive at what we do.SmartDraw VP has a good balance of tools for many of the tasks that you may need to accomplish throughout the day. While the mind mapping features that are found in SmartDraw VP are not as extensive as a stand alone application there is a synergy among the tools that might make it an ideal tool for the work you do. The mind mapping tool in SmartDraw VP is ideal for brainstorming, project planing and for developing time lines. SmartDraw VP lets you quickly move from the mind mapping view to a time line or Gantt chart view with a click of the mouse. In the recent upgrade to SmartDraw VP you will now be able to format your mind map Center, All Right or All Left giving you new options for how your mind maps are displayed on the screen. I for one find that many people who are not familiar with mind mapping have an easier time when I present a mind map using the All Right formatting. Similarly, it is now really easy to create a mind map in SmartDraw VP by importing a text outline. I tried this feature by typing a simple outline into the Notepad and importing it into SmartDraw VP. After each main idea I pressed the Enter key and for each subtopic I used the Tab key to indent the text. Once I had my outline completed I used the new Import Text Outline feature and voila there I had a perfectly formatted mind map.If you are eligible I would highly recommend that you upgrade to the latest version of SmartDraw VP so that you can take advantage of these new mind mapping features. SmartDraw VP is a handy tool with lots of ways to help you become more productive in your working environment. If you haven't taken a look at SmartDraw VP, it has a good balance of tools that can give you the edge as you head down the path to becoming a better visual communicator. You can download a 30 day trial of SmartDraw VP by clicking on this link.
MindManager Version 9 Demonstrates Business Productivity Benefits of Mindjet’s Next Generation Software
Tight Integration of Visual Information Mapping with Microsoft Office, Web Services and Core Business Systems Helps Business Professionals Work More Efficiently
San Francisco – August 10, 2010 – Mindjet®, the leading provider of software and web- based applications for visually organizing and managing information and ideas, today announced the general availability of version 9 of its visual information mapping software, MindManager. MindManager gives information workers the resources they need to see the big picture and all the relevant details needed for analysis and planning, within a single, easily edited view. MindManager, already used by over 1.5 million business professionals worldwide, is taking a quantum leap forward with this new release of its flagship product. This latest version greatly enhances the usability of Mindjet’s award-winning application, allowing it to integrate more seamlessly with users other MS Office applications, web services and collaboration platforms.
Business professionals are inundated by an overwhelming amount of content, communication and information that stifles productivity and creativity. With new features including an enhanced integration with the Microsoft ® Office suite, one-click Outlook integration and ability to connect with Microsoft SharePoint®, MindManager provides a single environment that professionals can use to unify and organize diverse information.Mindjet continues to accelerate planning, development and creativity to complete projects more successfully, accomplish more and improve communication.
"For people who have never used mind mapping software before, MindManager Version 9 promises to be the easiest version of this program to use, ever. For corporate IT departments that can't quite understand why they should deploy a visual mapping tool like MindManager, the SharePoint integration is the coup de grace," said Chuck Frey, author of the Mind Mapping Software Blog.
With this new release, MindManager becomes the one-stop destination for working on any kind of project. Within MindManager, users have access to tight integration with Microsoft Outlook and Office to keep the constant stream of information for a project organized in one easy-to-access location, a visualization and dashboard tool for any SharePoint environment with MindManager Explorer for SharePoint and collaboration tools, real-time map co-editing and web based document storage with Mindjet Catalyst.
Key Features in MindManager Version 9 for Windows:
·Microsoft Outlook® Integration – Features more powerful integration with Microsoft Outlook tasks, emails, notes, calendar items and contacts to easily bring relevant information from Outlook directly into your MindManager maps for greater access and visibility into your projects and work. Synchronized branches of Outlook tasks can be added to maps and visualized in MindManager’s integrated Gantt chart.
·Microsoft PowerPoint® Integration – Users can now easily use MindManager to research and map out presentations and then export their ideas from MindManager directly into PowerPoint slides to accomplish more, faster.
·Interactive Slide Shows – Unlike ‘broadcast’ presentations, MindManager introduces a new way to present and collaborate on concepts, strategies and plans. Users can launch interactive slide shows directly within MindManager to review selected portions of their map, solicit feedback and update their map content directly in each slide.
·Gantt Chart and Resource Views – Individuals can view task and project plan timelines in MindManager’s integrated and synchronized Gantt chart. Updates can be made to maps by adjusting the Gantt chart or by making changes directly into a map. The resource views highlight when individuals are over or underutilized in both your map and the Gantt chart.
·MindManager Explorer for SharePoint (sold separately)– Visualizes SharePoint content in MindManager’s easy-to-use dynamic maps. With bi-directional SharePoint integration, users can more easily discover, aggregate and update their SharePoint content from one or more SharePoint sites.
“Mindjet’s users have always understood the benefits of visually organizing information, data, content and documents and how this drives innovation and increases productivity,” said Scott Raskin, CEO of Mindjet. “The latest release of MindManager Version 9 reinforces the idea that organizing information in a visual manner will dramatically improve an organization’s productivity, creativity and business output. MindManager is now evolving from a product that makes project management easier and more organized, to the must-have tool that businesses and individuals use to capture, organize and present all of the information needed do get the job done right.”
MindManager Version 9 for Windows is available in three languages: English, German and French, and can be purchased through www.Mindjet.com for $349 for new users or for a limited time, $149 for an upgrade.
Mindjet provides productivity software that helps business professionals visually organize and act upon ideas, information and resources to drive productivity, team effectiveness and business innovation. Mindjet products include industry-leading software and online services centered on information mapping, as well as applications that incorporate Mindjet’s innovative visualization technology to improve the usability of leading business applications, including Microsoft SharePoint and Salesforce.com. More than 1.5 million people around the world use Mindjet software to clarify thinking, efficiently analyze information, increase team productivity, and make better-informed decisions.
Used by business professionals in 44 of BusinessWeek’s 50 “World’s Most Innovative Companies,” Mindjet solutions dramatically boost productivity and team effectiveness. Surveys across several industries show that Mindjet can increase productivity by up to 25 percent by making meetings, common communications and project management tasks more efficient and effective. Mindjet products are available for free trial or purchase at www.mindjet.com/products/overview, through salesforce.com AppExchange, and through an extensive partner network at www.mindjet.com/community/partners/overview. Mindjet is headquartered in San Francisco and has offices throughout the U.S., Europe and Asia.
On Monday June 28th, MindGenius will release Version 3.6 which will add some new features to the Gantt View as well as the ability to open MindManager (Version 7 and above) files and OPML formatted files into MindGenius. So if you are a MindGenius 3 users I would suggest that you go over to the MindGenius website and download the free upgrade.
We are pleased to announce we are continuing the major development program we started with the release of Version 3 last year. Version 3.6, one of our regular maintenance releases, will be available from Monday 28th June and is free to all MindGenius Version 3 customers. As well as routine maintenance work, MindGenius Version 3.6 includes functional updates to the Gantt View and the addition of a file convertor which allows users to import data from MindManager and OPML formats.
The Gantt view has been extremely well received since its release in March. User feedback on the Gantt View regarding the timeline being fixed units has been addressed with the addition of the ability to set the timeline scale to an appropriate unit of time such as Quarters, Months, Weeks, Days and Hours, as well as a zoom facility to scale the Gantt view to match your overall project duration.
In response to the number of organisations participating in a wholesale deployment of MindGenius to all desktops, we have developed the ability to be able to import maps from Mindjet’s MindManager.Any legacy maps held in the MindManager format can be seamlessly brought across into MindGenius and enable the entire organisation to move forward with MindGenius as the single map format, thus making the sharing of maps considerably easier.
OPML (Outline Processor Markup Language) is an XML format for defining hierarchical data and is suitable for many different types of data lists and is used mainly to exchange data lists on the web. It is also used as a file format for certain iPhone/iPad applications such as MindNode & iThoughts.
Simply select File \ Open to import any of these file types into MindGenius.
This Import functionality has the ability to be extended to import from other sources and suggestions from our customers are very welcome.
Derek Jack, Company Director for MindGenius said:
“Fundamentally, MindGenius is a client driven business.Each release reflects the priorities placed upon us by our client feedback.We appear to have struck a chord with our recent addition of the GANTT functionality within the map.Many customers are enjoying the seamless integration between unstructured data gathering and planning, and then distilling this data into a fully functioning GANTT view.This latest 3.6 release is a reflection of the scale of adoption we have witnessed and the consistent feedback around key improvements we can make to this specific feature. We trust you will enjoy the new capabilities and openly encourage your continued feedback.”
Last week I downloaded MindGenius 3.5 which added support for Gantt Charts right within the application. I have had the chance to develop some Gantt Charts using MindGenius and wanted to share my ideas about this new feature with you. Overall, you will find the implementation of Gantt Charts in MindGenius 3.5 to be easy and straight forward to use. Most of us who have been following the mind mapping arena have seen that almost all of the major applications have moved to including Gantt Charts as part of their solution. Mind mapping applications are a great tool for brainstorming and sharing information about new projects that are coming on-board. The visualization of the project makes it easy for everyone involved to see the project from another perspective by literally putting everyone on the same page. Likewise, mind mapping applications like MindGenius 3.5 makes it easy for the team, when you are ready to develop the Work Breakdown Structure.
In MindGenius you would build your project in the mind mapping view and then click on the Tasks Tab on the Ribbon to access the features associated with the Gantt Chart. You will find it easy to assign Start, End, and Due Dates for each task in your mind map by selecting them from the Calendar. You can also record what percentage of the task is complete, the priority for the task as well as the status for each of the tasks. You can also record the duration of the work completed and estimates for the how long the task will take to complete. If you intend to use your mind map to track your costs you can include a Cost and Quantity for each item in your mind map. If you decide to include the Cost and Quantity in your mind map you can then export and generate reports in Excel. Once you have entered Start and End dates and the other information you can view your Gantt Chart by clicking on the Gantt View Button from the Tasks Ribbon.
MindGenius displays a very traditional Gantt Chart with with your tasks listed down the left side of the page. If a task has multiple items associated with it, MindGenius treats the higher level task as a Summary Level task and each item under that a child task. Tasks and subtasks can be linked using the Linking tool that is provided. As far as I can tell MindGenius 3.5 only supports Finish to Start Dependencies and does not allow for lag time. The Gantt Chart is MindGenius 3.5 clearly shows what percentage of the task is complete and can be manually changed by the user as they update the progress of the project. I would have like to be able to change the color of the bars in my Gantt view but I did not see this as an option. Assigning resources to a task is rather easy in MindGenius 3.5 you simply select the person from the Resources pane. One of the strengths MindGenius 3.5 is the ability to quickly generate a Resource map by Tasks with a click of the mouse. This helps to quickly visualize who has which task assigned to them and the responsibility for the completion of the task. Probably one of the most powerful features that is found in MindGenius 3.5 is the ability to filter the information in the Gantt Chart. There are some Quick Filters that let you quickly see the status of your project when you select one of the filters. If you find that the Quick Filter does not meet your needs you can open up the Filter panel and begin to customize it for your needs. There is also a Filter Builder for building more sophisticated filters if you need it.
All in all, if you have MindGeniu3 you should download the free upgrade to MindGenius 3.5 and begin to explore the Gantt View. For small projects MindGenius 3.5 could be just what you need to keep tabs on your projects. If you need to, you can quickly generate reports from within Excel or export you projects to Microsoft Project. Having access to the Gantt View is certainly a welcome addition to MindGenius 3.5 and one that users will find considerable value in using.
MindGenius Ltd are delighted to announce the upcoming release of MindGenius 3.5, which has been developed as part of our ongoing commitment to product development and response to customer needs. This release of the mind mapping software contains an integrated Gantt view, providing extensive project management capability within MindGenius without the need to export to other applications and is free to all existing MindGenius V3 customers. A unique and powerful feature of the MindGenius Gantt view is the ability to use the map explorer to focus on specific areas of the project plan. Since it is not unusual to have a project plan of a couple of hundred lines or more, this makes it much easier to plan and schedule projects, easily switching back and forward between the map and Gantt views which are continually in sync with each other.
The Gantt view also integrates with the MindGenius quick filters, simplifying project management by allowing you to quickly identify tasks assigned to each individual, tasks due or overdue, milestones, critical path and status. MindGenius 3.5 is free to all current V3 customers and will be available next week, look out for our announcement email which will also contain details of upgrade pricing for V1 and V2 customers.
The Gantt view further extends MindGenius’ reputation as the mind mapping tool for business. We have also added the Gantt view to MindGenius Education as a cost effective solution for the management of student, school, college and university projects.
A couple of months ago I wrote a blog post about Gantt Charts and Timelines You Decide which raised the issue with regards to which views project managers and their stakeholders prefer. While I didn't get a large number of readers to complete the survey-most readers seemed to lean towards using the Timeline View to communicate the status of the project. It would seem that if you are not a professional project manager that reading Gantt Charts could pose a problem. There is a great deal of clarity that can be derived from looking at a Timeline and the information is much more digestible. In the original post I talked about how MindView 3 Business Edition from Matchware enables you to communicate the information in either a Gantt Chart, a Timeline or a Combination Timeline/Gantt Chart View. So depending on your audience you can decide how to share the information visually, that is best suited for your stakeholders.
In light of my July post it was interesting for me to come across the blog post from the Microsoft Project Team Blog that announced that they had added a Timeline View to MS Project 2010. From the post it looks as if there will be lots of ways to customize and format the Timeline. The post also noted that you will be able to copy and past the Timeline information into the other Office Products. It is my understanding that the Timeline will come in as Office Art shapes that will then allow you to format it to your hearts content. So I would like to believe that my post swayed the large Seattle company called Microsoft to add the Timeline view- but who am I kidding! In any case it is great to see that tools like MS Project 2010 will give users a flexible tool for communicating project information and status.
I have been a SmartDraw user for some time now and was delighted to learn that SmartDraw 2010 was soon going to be released with some new mind mapping and project management features that I was interested in exploring. As I shared with you in a previous post I was introduced to some of the new features of SmartDraw 2010 by the CEO Paul Stannard who is extremely passionate about the product. One of the markets that SmatDraw realizes there is a strong need for their product is in the area of project management. So with this release they have added more functionality and have made the product easier to use and have cut down on the steps it takes to go from mind mapping a project to creating a Gantt Chart or a timeline.
In SmartDraw 2010 you will still find it easy to create a basic mind map using the the SmartPanel. If you want to create your mind map even faster in SmartDraw 2010 you can quickly create a mind map using the Control and Arrow keys to create your ideas on the screen. I found this quite intuitive and within minutes was able to complete a mind map. If you like there are several mind mapping templates that ships with SmartDraw 2010 can be a great starting point for your session. I personally would have liked to see more templates and be able to have the option to change the direction of the mind map so that I could have top to down or left to right. You will find in SmartDraw 2010 that you can easily apply styles, so that your finished mind map has a a very professional and polished look. You will also find that SmartDraw 2010 spaces everything just so that branches on your mind map are equidistant from one another which is a nice touch. There are lots of ways to share you maps in SmartDraw 2010- you can export it 12 different file formats- everything from PDF to HTML or send it to Microsoft PowerPoint. The list is extensive! SmartDraw 2010 has also added the ability for users to add Comments on the mind map so that when they are shared they can be reviewed somewhat similar to the feature found in Microsoft Word. This is a wonderful feature especially in corporations that are using SharePoint. SmartDraw 2010 integrates seamlessly with SharePoint and lets you browse your server and open SmartDraw files.
Going from your mind map in SmartDraw 2010 to a Gantt Chart or Timeline is very easy. Simply select the View As button and select Gantt Chart or Timeline. Within seconds your Gantt Chart is displayed on your screen. SmartDraw 2010 has been updated and will allow you to manage much larger projects than in the previous version. I believe that in SmartDraw 2009 the limit was 100 tasks. You will also find that moving around SmartDraw 2010 even with larger data sets is easy to do and the program doesn't even skip a beat. SmartDraw 2010 now shows a Summary bar when you have subtasks under a topic- which works really well. HOwever, I would have like to see the Summary bar automatically reflect the percentage of the work done based on the completion entries in the subtasks. For now you will have to enter a the percentage completion value into the Summary task manually. You now more control of the information that is shown on the Columns in your Gantt view and it is easy to add Start Dates, End Dates, Cost, Duration, % Complete, Department, Number, & Resource to your Gantt chart. Whiel SmartDraw 2009 supported Finish to Start dependencies, it is a lot easier to set them up in the SmartDraw 2010. Unfortunately SmartDraw 2010 does not support Start to Start, Finish to Finish or Finish to Start dependencies. When you have completed your Gantt Chart in SmartDraw 2010 you can also export it to Microsoft Project. Likewise, you can also import data from Microsoft Project and bring it into SmartDraw 2010.
It is now just as easy to create a timeline from your mind map which is just a click away. Simply select the Timeline option from your mind map and within seconds you have a professionally delivered timeline of your project which for some will be able to comprehend more easily than if it were presented as a Gantt chart. You will find SmartDraw 2010 a flexible and easy to use application to handle small to medium projects. It is an ideal tool for communicate your project and getting all of your stakeholders on board. You will find it easy to print our comprehensive Gantt charts and timeline which can go a long way to keep your projects on time and within budget. For more information about SmartDraw 2010 click here.
I just found out that Matchware has released Service Pack 1 for Mindview 3 which can be downloaded from their website. I have upgrade my version of MindView 3 BE to the latest version without a hitch. MindView 3 feels faster when changing from the various views. Going from a Mind map to a Gantt Chart is much faster than in previous versions. Give it a try and let me know what you think. You can download the Service Pack 1 by clicking on this link. According to the Matchware website here are some of the features of the Service Pack 1.
This Service Pack contains the following changes:
Service Pack 1:
Panels now include scroll bars when screen resolution is low or when space is limited.
Converting between views has been slightly optimized.
Branch text editor: Several usability issues and other problems have been corrected.
Icons: The Icons gallery now closes upon selection of an icon.
Outline view: The font settings can now be changed as expected.
Spellchecker: The problem whereby correct text was sometimes underlined in red has been resolved.
Word export:
PDF files are now handled correctly.
Links to embedded files are now handled correctly.
Pictures located in text notes on the Mind Map are now shown in the exported Word document.
PowerPoint export: The problem whereby comments were not exported to PowerPoint when using a non-English version of MindView has now been fixed.
SharePoint: Now fully compatible with SharePoint 2003. With SharePoint 2007 it may be necessary to check out the file before being able to save it from within MindView.
Many other usability and internal issues have been corrected.
Resources:
Adding resources from the Address Book now works as expected.
Resources assigned to tasks are now preserved when copying to another document.
Dragging a link from the web browser onto a branch now creates a hyperlink.
The Calculation Defaults and Formats dialog now supports localized decimal separators.
Excel export: You can now export to Excel even when Excel is not installed, but you will only be able to save the file in the XML 2003 Spreadsheet format.
HTML export: New export templates have been included.
Microsoft Project import: Files containing unsupported characters can now be imported.
It is now possible to export to the older OpenMind/MindView 2 XML format.
In the early 1900's Henry Gantt introduced us to what is commonly referred to as the Gantt Chart, a way of visually communicating tasks and the timeline for each. In his 1919 book "Organizing for Work" [6] Gantt gives two principles for his charts:
one, measure activities by the amount of time needed to complete them;
two, the space on the chart can be used the represent the amount of the activity that should have been done in that time.
A lot has changed since 1919, and with the advent of computer technology we have seen a number of business project management software applications that take Gantt Charts to a whole new dimension. With the power of the personal computer we can now show not only task completion but the inter-dependencies of the tasks as they relate to the project completion. As more and more information gets added to the Gantt Chart and the visual complexity increases it certainly adds a real cognitive load for many, to make sense of the data. Recently, Wallace Tait and I had a conversation about Gantt Charts and their utility-which lead us to talk about the advantages and disadvantages of the visual display when presenting information in a Gantt Chart. One of the real advantages of using Gantt Charts is the fact that it can pack a lot of rich information into a small area. But this can be its downfall as well-and it does take a certain knack to be able to decipher the information and the dependencies that are often displayed in a Gantt Chart.
While Gantt Charts have a rich tradition some people may have difficulty understanding the complexities that are displayed on the screen and choose not to use them to communicate project information. In this regard, some users may want to opt to use a Timeline to convey project information which is a more sequential way at looking at a tasks over time. While you certainly lose out on the richness of the Gantt Chart you are quickly able to see the flow of the project and when things need to be done. One mind mapping application that bridges the gap between Gantt Charts and Timelines is MindView 3 BE. In MindView 3 BE, you have the choice of looking at your project in various modes: as a mind map, a Gantt Chart, or as a Timeline. You can check out my previous post on MindView 3BE to learn about the features and the project management tools. MindView 3 BE even lets you display your project using a cross between a Timeline with Duration bars. So the question I leave you with is: What are your preferences when you are displaying project information? Please complete the survey that I put together about Gantt Charts. I will report the results once they come in.
With the imminent release of billion of dollars to the public schools for the purchase of assistive technology and professional development I saw an opportunity to reach out to my colleagues and give them some pointers and tips for planning for this event. During the past couple of years I have had the pleasure of being a presenter on several webinars but have never actually been the one in the trenches setting it up and marketing the event. I decided about a month ago to sponsor the free webinar on the President's Recovery & Investment Plan for 2009 and how it would impact on the work that we do under Individuals with Disabilities Education Act (IDEA). The initiative is clear that there is a priority for schools to have access to state of the art assistive technology devices and to provide intensive professional development for regular and special eduction teachers.
In order to pull this webinar together I had to do a fair amount of planning and make some decisions about the screensharing platform as well as the audio conferencing portion of the webinar. During the planning stages I was reviewing MindView 3 and decided to take a look at how I could use the Gantt Charts and Timeline features to plan for the event. Using the Timeline feature really highlighted the series of steps that I needed to accomplish to pull off the event. Being able to go from the Gantt View to the Timeline View was very helpful in seeing the big picture. Having access to these tools allowed me to visually plan the event and keep me focused. Having used Glance for some time now, I decided to go with this platform, which worked like a charm. In order to deliver the audio portion I decided to use the teleconference service that was provisioned to be used with Glance.
Prior to the event I did a run through using the teleconferencing service so that I woud know how to change the audio features when running the webinar. You can never be too over prepared for your webinar when anything could happen with the technology. It is important to consider having a back up computer ready in the wings when doing the webinar. As far as your audio equipment, I used a high quality headset that was plugged into my phone system so that my hands were free during the webinar. I also had my computer directly connected via the Ethernet port to ensure that my connection was as fast as possible when sharing my screen. These are some tips that I would pass onto anyone who is considering doing a webinar.
With this out of the way I could now focus on the content and the marketing of the event which made me look at some of the Web 2.0 technologies to help spread the word. I used my blog to jump start the marketing campaign and using my auto-responder from A Weber, individuals could easily sign up for the webinar and would automatically receive a series of emails from me instructing them on how to log onto the webinar and other information that would be helpful on the day of the webinar. I decided to setup five different correspondences for the event and some reminders the day of the event that would automatically get broadcasted. Using Twitter, I was able to share with those followers information and a link to my blog to about the event. I also decided to use Ning to get the information out. All told my marketing campaign did work and I was able to deliver my webinar as planned on April 29th. I consider it a big success and something that I will continue to do in the future as part of professional development services that I can deliver to schools across the United States. There is certainly a lot of planning and things to consider when designing and delivering a webinar. I hope this gives you some insight into the process so that you can consider doing the same thing.
I had a chance this past week to take a look at MindView 3 Business Edition, which is the latest offering from Matchware, Inc. MindView 3 is a full featured mind mapping application that is a significant upgrade from what used to be known as OpenMind 2. MindView 3, takes full advantage of Microsoft's Fluid Ribbon Interface and makes navigating, formatting, and working with your mind maps easy to jump into. MindView 3 is unique in that it offers the user a full featured mind mapping application as well as including project planning (GANTT charts) and Timeline views that are integrated into the application. I will speak more about these features in part 2 of my review.
When MindView 3 opens you can quickly start creating a new mind map, Outline, Timeline or Gantt chart from the template provided. There is also a complete library of mind map templates that are more specialized that you could start your map from. Once you select your mind map you are ready to get started to map your ideas. From within MindView 3 you can designate the style of the map that you would like to create and you have the option of creating a tradional map with your ideas radiating from the center and going out as well as selecting top-down and left/right maps. To get started you simply type you main idea and press the Enter key to have you ideas radiate from your central point at the same level. To create a sub-branch you can click on the Sub-branch icon on the ribbon or simply Press the Insert key on your keyboard. Generating your ideas moves quickly using the keyboard and within minutes you should be able to flesh out your mind map. Moving ideas on your mind map is easy and intuitive as the program gives you visual feedback along the way. With MindView 3 you can quickly add icons to your branches and sub-branches by selecting the branch and accessing the Icons from the Insert ribbon. This is a fair number of icons that when inserted will appear to the left of your idea in the branch or sub-branch. The icons cover prioritization, arrows, task completion, stars, and library of commonly used icons. You can also access a large library of clip art which can be searched from within MindView 3. Once you find the picture you are looking for you can drag it to the branch. Unless you are using a Floating Picture as it is referred to in MindView 3 the graphic will sit above the branch. While you can select the graphic and make it larger or smaller you can not place it as an inline graphic within the branch. You do have the option of bringing in any graphic of your choice as a Floating Picture which allows you to move the graphic anywhere on your map. Attaching multiple files and hyperlinks to your branches is straight forward and easily accomplisehd using the Ribbon interface. MindView 3 makes it easy to add text notes to your map and opens a large text window at the bottom of the screen to accomplish this. Using the text editor you have the freedom to format to your heart's content, as well as giving you the opportunity of inserting pictures, tables, and hyperlinks.
Formatting your mind map is very intuitive and easy within MindView 3 using the Design ribbon. Using the Design Ribbon you can quickly select from Layouts, Styles and Effects which can quickly let you format your map just the way you want to. To format the branches and sub-branches you will need to access the Properties menu from the View Ribbon to bring up the options. You can also add boundaries around your sub-branches and format them with a range of colors, gradients and fills to highlight certain areas of your map. When using MindView 3 for presentations you will find the Focus Mode and the Apply Branch Focus to be two very helpful features. If you have designed very large maps these two features help to bring your ideas into focus on the screen. The Focus Mode zooms in on your map and what you have selected and brings into focus the branch or sub-branch. Using the Apply Branch Focus will hide all of the other branches except the one you are focused on allowing you to zero in on your topic. Navigating through the two features is fast and intuitive. MindView 3 also has powerful filtering features which lets you set up rules for showing certain branches that meet the criteria. You can use Boolean logic to only show those items in your map that meet the criteria. If you have a designed a large map this feature will come in handy.
When it comes time share and distribute your map MindView 3 gives you lots of options to output your map. You can export your maps very quickly to the Microsoft Office Suite of tools including: Word, Excel, PowerPoint, Outlook, and Project. I found the exporting to be very fast and clean with lots of options for tailoring the output. Each export gives you the option of doing a Quick or Advanced export depending on your need. MindView 3 supplies you with lots of Export templates to choose from to make your documents, presentations and projects come to life.
There is a lot to like about MindView 3- in no time you will be developing your mind maps complete with pictures, icons, and links. I found MindView 3, with the Fluid Ribbon Interface very easy to use and quick and responsive. With robust exporting to the Microsoft Office Suite, MindView 3 makes sharing and distributing your maps a cinch. In my next post, I will highlight the GANTT and Timeline feature that is built right into MindView 3 which really makes this a unique software application. Mindview 3 is a formidable mind mapping software application with a sweet spot for those who want built-in project planning tools. Look for Part 2 of this review that delves into the project planning, using calculations and the timeline features found within MindView 3.